


Just because I'm feeling mellow, here's a cool video for a cool song, "Bathtime in Clerkenwell" by The Real Tuesday Weld.
Sunday, September 28, 2008
Saturday, September 27, 2008
Piano tuners
So how many piano tuners are there in Chicago?
I approached the problem this way: I know the city of Chicago has more than 1 million people, and I think it has less than 10 million. I was going to say that I think it has closer to 10 million--something like 6 or 8--but I decided to go with the rule of thumb and use the geometric mean, or 3.15 million (I'm glad I did--we'll see why in a minute). I figure that the proportion of piano tuners is somewhere less than 1 in a 1,000 people--I've only ever met one, and that was when I was a kid and we had our piano tuned--but that they're probably more frequent than 1 in 100,000 people. The geometric mean would then be that 1 in 10,000 people are piano tuners (come to think of it, my home town had about 10,000, and he might have been the only piano tuner in town--pretty good estimate). OK, so 1 in 10,000 people out of 3.15 million Chicagoans is 315 piano tuners, Q.E.D. Time to hit Google...
So, it turns out the population of Chicago is 3 million--thank you geometric mean! And estimates of tuners? Here's one example:
An interesting solution (Wikipedia gives essentially the same)--I would never have tried to estimate the time it takes to tune a piano, about which I know nothing (although in hindsight I suppose I know that it doesn't take more than a day--it certainly didn't for that guy when I was a kid--and it probably takes more than an hour, so the geometric mean of 1 and 8 hours is about 2-3 hours!). Still, I like my solution better--I made fewer estimates. ;)
Interestingly, I didn't find anywhere how many piano tuners there actually are in Chicago.
I approached the problem this way: I know the city of Chicago has more than 1 million people, and I think it has less than 10 million. I was going to say that I think it has closer to 10 million--something like 6 or 8--but I decided to go with the rule of thumb and use the geometric mean, or 3.15 million (I'm glad I did--we'll see why in a minute). I figure that the proportion of piano tuners is somewhere less than 1 in a 1,000 people--I've only ever met one, and that was when I was a kid and we had our piano tuned--but that they're probably more frequent than 1 in 100,000 people. The geometric mean would then be that 1 in 10,000 people are piano tuners (come to think of it, my home town had about 10,000, and he might have been the only piano tuner in town--pretty good estimate). OK, so 1 in 10,000 people out of 3.15 million Chicagoans is 315 piano tuners, Q.E.D. Time to hit Google...
So, it turns out the population of Chicago is 3 million--thank you geometric mean! And estimates of tuners? Here's one example:
From the almanac, we know that Chicago has a population of about 3 million people.
Now, assume that an average family contains four members so that the number of families in Chicago must be about 750,000.
If one in five families owns a piano, there will be 150,000 pianos in Chicago.
If the average piano tuner
serviced four pianos every day of the week for five days
rested on weekends, and
had a two week vacation during the summer,
then in one year (52 weeks) he would service 1,000 pianos. 150,000/(4 x 5 x 50) = 150, so that there must be about 150 piano tuners in Chicago.
An interesting solution (Wikipedia gives essentially the same)--I would never have tried to estimate the time it takes to tune a piano, about which I know nothing (although in hindsight I suppose I know that it doesn't take more than a day--it certainly didn't for that guy when I was a kid--and it probably takes more than an hour, so the geometric mean of 1 and 8 hours is about 2-3 hours!). Still, I like my solution better--I made fewer estimates. ;)
Interestingly, I didn't find anywhere how many piano tuners there actually are in Chicago.
Coincidences
So, in one of those weird life coincidences, I was catching up on my Science reading at Starbucks this morning, and came across this review by Stephan Mertens of the book Guesstimation. The review (and the book) is about how physicist Enrico Fermi cultivated the skill of back of the envelope calculations--being able to roughly approximate results from limited data and general knowledge. For instance, the number of cells in a human being is deducible from an estimation of the smallest object the eye can see, the power of early very poor microscopes, the density of water, the mass of the average human, and the fact that we float. Interestingly, the result of this calculation is exactly the number you always see bandied about--100 trillion. They picked a pretty good example!
Other suggested problems in estimation are: How long a hot dog can be made from a typical cow? How many people are airborne over the US at any given moment? What is the photon flux at the eye from a faint visible star? How many piano tuners are there in Chicago?
One of the suggested rules of thumb when making wild approximations is to use the geometric mean rather than arithmetic mean. The geometric mean is the square root of the product of the bounds of the estimate, where the regular mean is the sum of the bounds divided by two. Thus, if your best estimate of the number of people who could fit in a VW bug was that it is more than one and less than 100 (a pretty poor estimate), the average is 50, but the geometric mean is 10, which is a pretty good guess. The geometric mean keeps the large value from dominating the result.
Anyway, I realized that geometric mean is precisely what I was using in the denominator of the CCV metric I've been speculating about. I should have realized that earlier, but I wasn't paying attention. A friend had suggested that a problem with using the CCV might be that it would be biased towards larger values, but I think that this means that that wouldn't be the case. Curiouser and curiouser...
Statistical queries

A statistical problem I've been pondering:
The normalization of the variance (well, standard deviation) can be accomplished by dividing by the mean to produce the coefficient of variation. However, the normalization of the covariance is accomplished by dividing by the standard deviations. Why can't the covariance be normalized by dividing by the means, producing a coefficient of covariation (CCV)?
If I take, say, N=10 one-acre samples from a forest, each sample may contain a certain number of two species of trees, A and B. You'll get an average number of each species per acre, XA and XB. Each will also have a standard deviation (SD), sA and sB. You can calculate a coefficient of variation (CV) of each species as X/s, and make meaningful comparisons of their dispersion, irrespective (largely) of the magnitude of their relative means--i.e., the dispersion measures have been normalized. I just generated some fake data, and species A has a mean of 14.4 and a SD of 4.2 individuals/acre, while species B has a mean of 7.9 and a SD of 3.2 individuals/acre. The CVs of the species, however, are 0.3 and 0.4, respectively, showing that B has a higher dispersion than A, even though its SD is lower.
You can find the covariance between A and B as sum((Xi-XA)(Xj-XB))/N, where Xi is the number of species A in the ith acre, and j for species B. (I realize the denominator may or may not need to be N-1 for arcane reasons, but let's not complicate this any more than it already is.) So far it still seems to be a measure of dispersion (or squared dispersion), although it's getting harder to say dispersion of what. This covariance reduces to the variance if one species is being compared against itself (sum(Xi-XA)^2/N). For this made-up data, the covariance is -11.46 individuals^2/acre^2, which indicates that they strongly negatively covary: When the population of A is high, B tends to be low (which I know because I set the data up that way). But exactly how strong? Is it significant? The respective variances are 17.8 and 10.0 (obviously: the squares of the SDs), so that at least gives us some sense of the magnitude of the covariation, but nothing very precise. If there was a third species, C, with a covariance to A of -12, it wouldn't really be clear if it was more or less covariant to A than B is, or by how much.
I know that the standard practice to normalize the covariance is to divide by the product of the SDs (sAsB) and generate a correlation coefficient (r=sAB/sAsB=-0.8 in this case--pretty strongly negatively correlated). I also understand the nice property of the correlation coefficient that it's capped at -1 and 1 (the normalization of the variance by itself; r=sAA/sAsA), which allows you to say if something is absolutely correlated, inversely correlated, uncorrelated, or somewhere in between. But the CV has a nice intuitive feel to it, because you're normalizing the SD by something easily understandable: the mean. Removing the central tendency component from a dispersion measure, leaving just the dispersion, and utilizing both parameters of the Normal distribution. Conversely, while the correlation coefficient itself is fairly intuitive, the method of generating it doesn't seem as concrete: You divide something that looks like a dispersion squared by two dispersions and get...well, something pretty darn useful, but it doesn't seem like what one would try a priori. To answer the a priori question "How do I normalize these covariances" (not necessarily the question "How do I generate a metric of correlation"), it seems like one would try the same trick that worked before--dividing something dispersion-y by something central tendency-y. Interestingly, the result of doing so is not very intuitive.
To put it another way, if you can normalize the variance/SD in two ways (by dividing by the SD, or by the mean, generating the correlation coefficient and coefficient of variation, respectively), why can you only normalize the covariance/co-SD one way (by dividing by the SDs)? Where's the fourth entry in this table--the memristor, if you will? The covariance (sum((Xi-XA)(Xj-XB))/N) reduces to the variance (sum(Xi-XA)^2/N) as a special case; the correlation coefficient (sAB/sAsB) reduces to unity (sAA/sAsA); it seems that some coefficient of covariance (sign(sAB)(sAB/XAB)^0.5) should exist where the CV (sign(sAA)(sAA/XAA)^0.5=sA/XA) is the special case reduction. (The CCV for this made-up data was -0.32.)
I'm not trying to use the CCV for anything in particular; r works perfectly well. I'm just wondering what the heck (if anything) this CCV thing is or would be, what its properties are, if it's been tried before, if it's called something else, if it's discussed anywhere, if anyone's heard of it, thought of it, tried it out, played with it, etc. None of my statistics books seem to mention it or anything like it, and Web of Science returned zero results. The one paper I found through Google, from a South African scientist published in the Pakistan Journal of Applied Sciences, is incomplete in the available online PDF (missing two middle of the five total pages, where presumably some important math occurs), is unavailable from my interlibrary loan office from any source, and the author hasn't replied to my emails yet. But I can't see why it's not more mentioned, since a priori it so seems like the way to approach things? It was certainly the first thing that popped into my head when I was sitting there tiredly looking at a few covariances I happened upon and wondering how to legitimately compare them. Normally, if I was trying to correlate something I would have gone straight to, duh, the correlation coefficient, without ever explicitly thinking about the covariances. But when unexpectedly confronted with covariances, I thought to myself, "Self, I need to normalize these. How? Well, covariances are, as far as I can tell, mathematical generalizations of variances. You normalize variances with the mean; I should be able to normalize these against an appropriately 'combined' mean--something like the square root of the product of the means." Google "coefficient of covariation" and, sure enough, the predominant hit is an (incomplete) paper containing precisely this equation. Spend 20 minutes calculating these CCVs before doing a face-palm and realizing you're computing an obscure or non-existent metric for something that would've been perfectly obvious if you'd had more caffeine. Redo calculations, and spend the next week wondering what the heck you were calculating, and how two such seemingly similar objects can be normalized in such strangely different fashions. Spend too much time on Wikipedia getting your brain warped by excessive Greek notation.
Surely, if there's such a commonly utilized non-normalized matrix (which seems pretty useless otherwise), and there's a common normalization that applies to the diagonal of that matrix, somebody would have tried the mathematically simple analogization of that normalization, and it'd be mentioned pretty early in the literature. And if that obvious attempt is a mathematical or interpretational disaster, you'd think textbooks would give a warning as to why it isn't useful to do, or someone would have published on why exactly it doesn't work; how it violates some assumption of normality, or is a biased estimator of thus-and-such, or some other statistic-ish problem. But so far I haven't seen anything...
Friday, September 26, 2008
Thursday, September 25, 2008
Pursuing Randomness
Ruminating some more on Nassim Nicholas Taleb's The Black Swan . . .

Say the income of Americans approximates a normal distribution (i.e., is Gaussian), as Taleb suggests most people, including economists and Wall Street, tend to assume, if only for simplification. Say the average American income is $50,000, and that the standard deviation in income is $10,000. Then about 16% of the population should be making more than $60,000 (and 16% less than $40,000). 2.3% of Americans should be making more than $70,000, and 0.2% more than $80,000. Only 0.003% of Americans should be making more than $90,000 a year (or less than $10,000). But it's a big country--0.003% of 300,000,000 is still 10,000 people! But for $100,000 or more, only 86 Americans should be found in the income bracket, and I think we can safely say there are more than that in this country. And for $110,000, the chances would only be one in three that any American would achieve that level of wealth.
Ok, but let's say that I grossly underestimated both the average American wealth (which I didn't), and the standard deviation thereof (which I to some extent just pulled out of my ass). Let's say instead that the average American makes $500,000, with a standard deviation of $250,000. In that case, the odds of any one person having an income of $2,000,000 are one in a billion--so we'd have about a one-in-three chance of seeing a twice millionaire in the US--again, I think we can safely say that we've got more than that.
In fact, if the least-earning American made $20,000,000 a year, and if the standard deviation in incomes was $20,000,000, the odds of seeing even one Bill Gates in the entire country would be one in 220,000,000,000,000.
As Taleb points out, book, music, and movie sales; incomes; fame; internet success; financial booms and busts; deaths in war; all these types of phenomena are non-Gaussian: The chances of the next one being unimaginably orders of magnitude larger than the last are far (far, far, far, far) greater than could be justified in the tail of a Gaussian curve.
I'm going to go stuff my money in my mattress (half of it--the other half I'm investing as venture capital in my future blogging empire). Thanks a lot, Taleb!
Books not to read?!
So, Times Online recently published a list of ten books not to read before you die, followed by an additional list of five further wastes of time.
To sum up, the books were:
I can't speak to all of these, but come on! First of all, back the fuck up off of Tolkien, or I'll have to take my nice-nerd gloves off!
And The Iliad is a very good book, though I suggest anyone who doesn't think so read the Fagles translation, which does a good job of transporting the emotion and dramatic tension across 27 centuries, where other versions can be dry as dust. Similarly, Dante's Inferno is incredibly good when translated by Ciardi, or when read by John Cleese. (The Purgatorio and The Paradiso still suck donkey balls, though.)
Catch-22 was almost, but not quite, Douglas Adams good. Of course, it was a surreally tragic comedy, so it wasn't quite going for Douglas Adams funny.
The Catcher in the Rye did kind of suck (though it's been about 10 years since I've read it--perhaps it's time for a revisit). Franny and Zooey was much better.
But most of these books deserve to be read, if only for historical context. I grant that some of these might be a bit tough to read at the beach or in bed, but this guy needs to get some audiobooks. I mean, if you can read Ulysses in a week or two of driving to back and forth to work, isn't it worth it, just to know what the culture is talking about?
(It's possible that I may have just been Ebert satired, but if so, I think it fails as satire for the same reason: If this list isn't this author's actual beliefs, there's certainly somebody crazy enough to have them.)
To sum up, the books were:
- Ulysses
- Lord of the Rings
- For Whom the Bell Tolls
- Remembrance of Things Past
- The Dice Man
- Fear and Loathing in Las Vegas
- The Beauty Myth
- War and Peace
- The Iliad
- Pride and Prejudice
- Atlas Shrugged
- The Leopard
- The Castle
- Catch-22
- The Catcher in the Rye
I can't speak to all of these, but come on! First of all, back the fuck up off of Tolkien, or I'll have to take my nice-nerd gloves off!
And The Iliad is a very good book, though I suggest anyone who doesn't think so read the Fagles translation, which does a good job of transporting the emotion and dramatic tension across 27 centuries, where other versions can be dry as dust. Similarly, Dante's Inferno is incredibly good when translated by Ciardi, or when read by John Cleese. (The Purgatorio and The Paradiso still suck donkey balls, though.)
Catch-22 was almost, but not quite, Douglas Adams good. Of course, it was a surreally tragic comedy, so it wasn't quite going for Douglas Adams funny.
The Catcher in the Rye did kind of suck (though it's been about 10 years since I've read it--perhaps it's time for a revisit). Franny and Zooey was much better.
But most of these books deserve to be read, if only for historical context. I grant that some of these might be a bit tough to read at the beach or in bed, but this guy needs to get some audiobooks. I mean, if you can read Ulysses in a week or two of driving to back and forth to work, isn't it worth it, just to know what the culture is talking about?
(It's possible that I may have just been Ebert satired, but if so, I think it fails as satire for the same reason: If this list isn't this author's actual beliefs, there's certainly somebody crazy enough to have them.)
Wednesday, September 24, 2008
Book recommendation
So I'm reading Nassim Nicholas Taleb's The Black Swan, and I'm thoroughly enjoying it (as I did his previous book, Fooled by Randomness). His basic thesis is that most of the events that profoundly shape our world--Google, the assassination of Archduke Ferdinand, 9/11--are fundamentally unpredictable, despite what pundits or analysts might say, or how predictable they may appear in hindsight. Pretty interesting stuff. Sections about the effect of using Gaussian thinking for non-Gaussian phenomena, the tendency to apply narratives to history--all kinds of cool stuff. And then, in Chapter 14 he says:
Well, the book came out a year-and-a-half ago. I'd call him prophetic, but the point of his book is precisely that these kinds of events are unpredictable.
As if we did not have enough problems, banks are now more vulnerable to the Black Swan [the rare, unpredictable, and extremely impactful event] and the ludic fallacy [applying rules for systems with well-defined uncertainty--i.e., games of dice--to situations with poorly-defined uncertiainty--i.e., unknown unknowns, where even the rules of the game are unknown] than ever before with 'scientists' among their staff taking care of exposures. The giant firm J. P. Morgan put the entire world at risk by introducing in the nineties RiskMetrics, a phony method aiming at managing people's risks, causing the generalized use of the ludic fallacy [. . .] Likewise, the government-sponsored institution Fanny Mae, when I look at their risks, seems to be sitting on a barrel of dynamite, vulnerable to the slightest hiccup. But not to worry: their large staff of scientists deemed these events 'unlikely'.
Well, the book came out a year-and-a-half ago. I'd call him prophetic, but the point of his book is precisely that these kinds of events are unpredictable.
Feelin' Carl Sagan-y
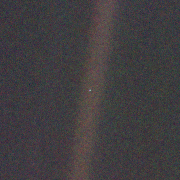
Don't know why, but this afternoon, I'm feeling kinda Carl Sagan-y--somewhat melancholy over the state of the world, what we insist on doing to each other, and how self-important we all seem to be about it. Anyway, here's The Carl's take on it:
Look again at that dot. That's here. That's home. That's us. On it everyone you love, everyone you know, everyone you ever heard of, every human being who ever was, lived out their lives. The aggregate of our joy and suffering, thousands of confident religions, ideologies, and economic doctrines, every hunter and forager, every hero and coward, every creator and destroyer of civilization, every king and peasant, every young couple in love, every mother and father, hopeful child, inventor and explorer, every teacher of morals, every corrupt politician, every "superstar," every "supreme leader", every saint and sinner in the history of our species lived there – on a mote of dust suspended in a sunbeam.
The Earth is a very small stage in a vast cosmic arena. Think of the rivers of blood spilled by all those generals and emperors so that, in glory and triumph, they could become the momentary masters of a fraction of a dot. Think of the endless cruelties visited by the inhabitants of one corner of this pixel on the scarcely distinguishable inhabitants of some other corner, how frequent their misunderstandings, how eager they are to kill one another, how fervent their hatreds.
Our posturings, our imagined self-importance, the delusion that we have some privileged position in the Universe, are challenged by this point of pale light. Our planet is a lonely speck in the great enveloping cosmic dark. In our obscurity, in all this vastness, there is no hint that help will come from elsewhere to save us from ourselves.
The Earth is the only world known so far to harbor life. There is nowhere else, at least in the near future, to which our species could migrate. Visit, yes. Settle, not yet. Like it or not, for the moment the Earth is where we make our stand.
It has been said that astronomy is a humbling and character-building experience. There is perhaps no better demonstration of the folly of human conceits than this distant image of our tiny world. To me, it underscores our responsibility to deal more kindly with one another, and to preserve and cherish the pale blue dot, the only home we've ever known.
From Pale Blue Dot. Or listen to him read it.
Monday, September 22, 2008

Big Stars
There have been plenty of similar videos recently, but this one is a pretty good presentation, with a nice techno score:
Sunday, September 21, 2008
Cognitive blindnesses
From a recent issue of Science:
"Curiously, people seem to be unaware of their own unawareness, rarely answering "I don't know" when asked to explain their decisions. People freely give reasons for their preferences, even when it is clear that these reasons are confabulations and not accurate reports. In one study, for example, researchers showed participants photographs of two women and asked them to choose the one they found more attractive. The experimenter then showed people the photograph they preferred and asked them to explain the reasons for their choice. On some trials, through sleight of hand, the experimenter actually showed people the photograph they found less attractive. It might seem that people would immediately see through this ruse, but surprisingly, they noticed the switch only about a quarter of the time. Even more surprisingly, in the 75% of the trials in which they did not notice the switch, participants had no problem coming up with plausible reasons for their choice. One participant, for example, said, 'She's radiant. I would rather have approached her in a bar than the other one. I like earrings'--even though he initially found the other woman, who wasn't wearing earrings, more attractive. Perhaps most tellingly, the researchers could not find any differences in the kinds of reasons people gave for their real versus their false choices, suggesting that people were confabulating reasons in both cases." (Wilson and Bar-Anan, Science 321(5892):1046-1047.)
Reminds me of the amazing demonstration in this video:
Or the many cool cognitive effects Richard Wiseman details in his excellent book, (which I cannot recommend enough) and in his YouTube videos:
Friday, September 19, 2008

Two giants
A few years old (2005), but here are two Giants, E. O. Wilson and James Watson, discussing Charles Darwin on Charlie Rose:
I know James Watson has had his PR problems lately, and I haven't really investigated the details, but a) I don't think he says anything terribly offensive herein; and b) regardless of things he might have unwisely stated recently, he's still a Giant, and listening to what he has to say is interesting (although he's not nearly as eloquent as E. O. Wilson).
I know James Watson has had his PR problems lately, and I haven't really investigated the details, but a) I don't think he says anything terribly offensive herein; and b) regardless of things he might have unwisely stated recently, he's still a Giant, and listening to what he has to say is interesting (although he's not nearly as eloquent as E. O. Wilson).
(If anyone wants to buy me either of the annotated Darwin collections they're shilling, you're welcome to.)
G. G. Simpson on SETI
Just read this Science article titled "The nonprevalence of humanoids" by G. G. Simpson. It's pretty dated (1964), and I disagree with pretty much all of his conclusions, but come on: It's George-freakin'-Gaylord Simpson. Reading anything he's thunk is pretty interesting, and the reference section contains a lot of interesting sources, such as Carl Sagan papers, and some original Miller-Urey stuff, etc.
(I apologize if people can't see the original article--I believe Science requires either an individual or institutional subscription. I feel that the basic scientific literature should be easily and freely available to everyone, but c'est la vie. Since I read a lot of primary literature, and would like to share the interesting stuff, hopefully I'll be able to figure out a way to provide access to it without violating copyright. If you actually want to walk down to the library for the article, the reference is Science (1964), 143(3608):769-775.)
"I don't think that evolution is supremely important because it is my specialty; it is my specialty because I think it is supremely important." G. G. Simpson
Liberals, Conservatives, and the moral mind
Jonathan Haidt gave a pretty good talk at TED on determining the inate moral values in humans, and how they determine our political choices. And I like the use of the Hieronymus Bosch triptych.
Welcome to Fardles Borne
So, welcome to my new blog: Fardles Borne.
What's this blog for? Basically, it's a way for me to procrastinate from working on my dissertation. And stay sane. (Maybe.)
What's it about? Generally, (I envision,) it's going to be about my interests: Science, books, reason, math, music, astronomy, evolution, philosophy, history, and anything generally geeky.
Comments are welcome, as are corrections--after all, this is a science blog, so factual statements should at least be accurate. Please call me on anything you find in error. General comment rules apply: Don't be a jerk, I reserve the right to delete, yada yada.
Oh, and thanks to Ryan P. from Soccergirl, Inc. for the idea for the blog name.
Thursday, September 18, 2008
Subscribe to:
Posts (Atom)